
PaperBanana
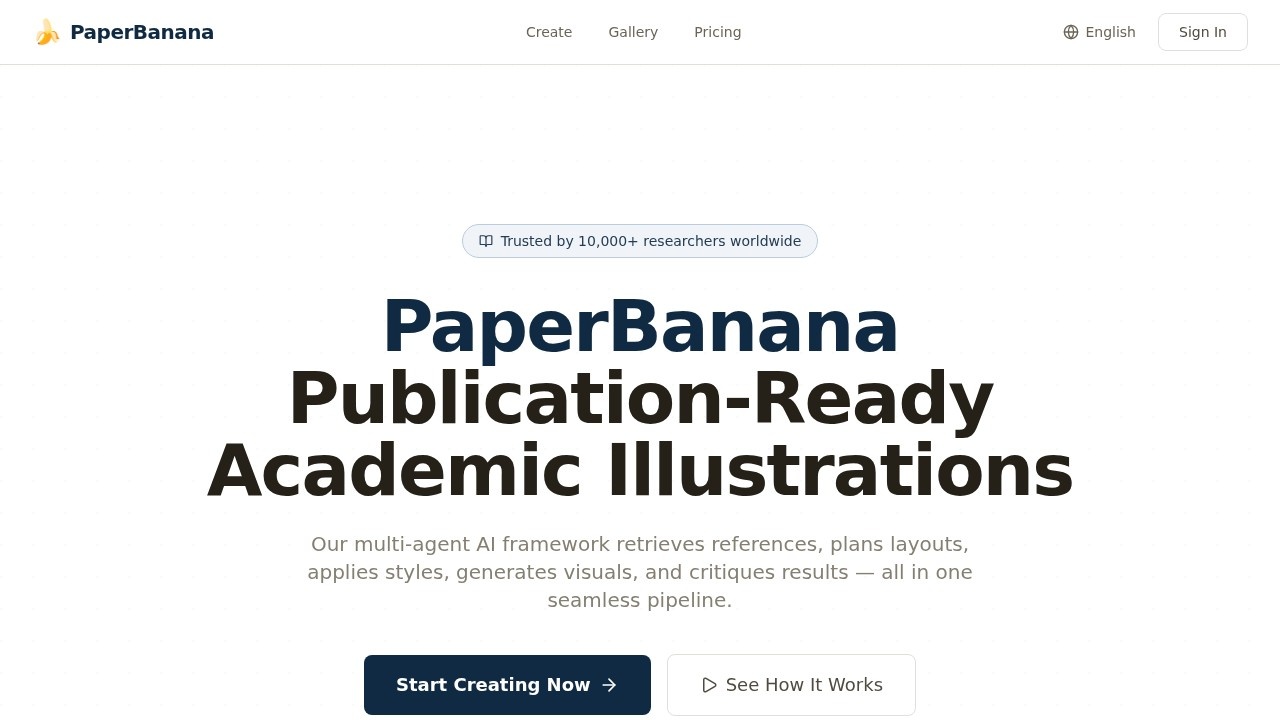
PaperBanana is a multi-agent AI tool by PaperBanana Studio for creating publication-ready academic illustrations, including methodology diagrams and statistical plots, in seconds.
What is PaperBanana?
PaperBanana is a multi-agent AI framework built specifically for generating publication-ready academic illustrations. Researchers describe their methodology or data in natural language, and the platform's pipeline handles everything from reference retrieval to final rendering. The tool produces two main output types: methodology diagrams for research methods and system architectures, and statistical plots for data-driven charts. It's designed to save researchers time—the site reports an average generation time of 5 seconds—while maintaining the visual standards expected in academic publishing.
Application scenarios
Methodology visualization
Describe your experimental setup or system architecture, and PaperBanana generates a clear diagram illustrating the flow.
Statistical plotting
Provide raw data in tabular or JSON format, and the tool renders charts and graphs via Matplotlib.
Transformer architecture diagrams
Use the built-in example to visualize encoder-decoder structures with attention mechanisms and data flow.
Paper figure preparation
Create visuals that are ready for inclusion in journal submissions, conference papers, or theses.
Research communication
Convert complex methods into visuals for presentations, posters, or grant applications.
Core Features
Multi-agent pipeline
Five specialized agents work in sequence—Retriever, Planner, Stylist, Visualizer, and Critic—to handle every stage of illustration creation.
Reference-driven generation
The Retriever agent searches academic databases for relevant reference illustrations and visual conventions from your field, grounding output in proven standards.
Methodology Diagram mode
Choose this option to illustrate research methods, system architectures, and algorithm flows.
Statistical Plot mode
Select this option for data-driven charts and graphs rendered via Matplotlib, with support for raw data input in tabular or JSON format.
Source Context input
Paste your methodology section or paper excerpt—up to 5,000 characters—to give the AI the technical details it needs.
Caption / Intent field
Specify the high-level message of the visualization, such as "Overview of our encoder-decoder architecture," so the output tells the right story.
Advanced refinement settings
Adjust iteration counts from 1 to 5; more iterations produce higher quality but take longer, with 3 as the default balance.
Iterative self-critique
The Critic agent runs multiple automated review rounds, checking visual clarity, label accuracy, color consistency, and adherence to academic standards.
Consistent academic styling
The Stylist agent applies uniform color palettes, fonts, line weights, and visual motifs across all generated illustrations.
Vector-like output
The Visualizer renders clean, pixel-perfect output designed for publication use.
Target users
PaperBanana is built for researchers and academics who need publication-quality visuals without spending hours in design tools. It serves scientists, engineers, and graduate students preparing papers for journals or conferences, as well as research teams that regularly produce methodology diagrams or statistical figures. The tool is also useful for anyone communicating technical research—such as grant writers, research communicators, or presenters—who need clear, field-appropriate visuals quickly.
How to use PaperBanana?
Start by visiting paperbanana.studio and clicking "Start Creating Now." Choose your diagram type—Methodology Diagram or Statistical Plot. For methodology diagrams, paste your methodology section or paper excerpt into the Source Context field (up to 5,000 characters). For statistical plots, provide raw data in tabular or JSON format. Enter a caption or intent describing what story the visualization should tell. Adjust advanced settings like refinement iterations if needed, then click "Generate Illustration." The platform's multi-agent pipeline handles the rest, and you can review and refine the output as needed.
Effect review
PaperBanana's multi-agent approach addresses a real pain point for researchers: producing publication-ready figures quickly and consistently. The combination of reference retrieval, automated styling, and iterative self-critique means the output is grounded in field conventions rather than generic AI-generated graphics. The 5-second average generation time and 50K+ illustrations created suggest the pipeline is genuinely fast and has seen meaningful adoption among the 10,000+ researchers the site reports. For researchers who regularly produce methodology diagrams or statistical plots, the tool could meaningfully cut down the time spent on figure preparation—though the quality ceiling will ultimately depend on how well the Critic agent's standards match individual journal or field requirements.
Frequently Asked Questions
What is PaperBanana?
Who can benefit from using PaperBanana?
What types of illustrations can PaperBanana create?
How does PaperBanana work?
Is PaperBanana free to use?
Can I customize the illustrations generated by PaperBanana?
PaperBanana - AI Tool Detail
PaperBanana is a multi-agent AI tool by PaperBanana Studio for creating publication-ready academic illustrations, including methodology diagrams and statistical plots, in seconds.
Category:Image generation
Visit Link:https://paperbanana.studio/
Tags:academic illustration、multi-agent AI、methodology diagrams、statistical plots、research tools